Brainwaves
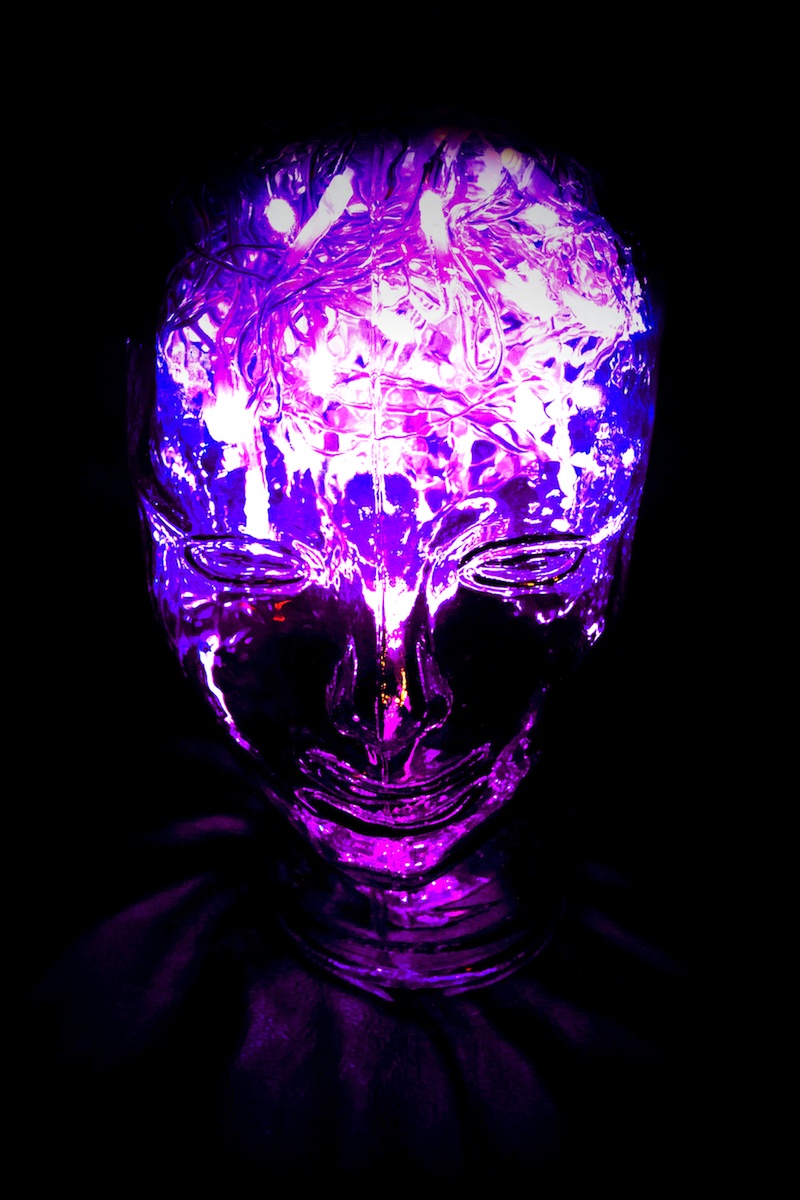
Imagine a brain, like the one in the photo, made from a string of fairy-lights. Imagine billions of lights in the brain, all blinking in a seemingly random pattern, passing electricity onto each other in a pattern that only makes sense to itself. Now imagine that wires can grow directly between bulbs that commonly light at the same time, making a connection between them.
That's pretty much what is happening inside our brain, except the fairly lights are neurons and the wires are neural connections. The power comes via tiny electrical impulses and electro-chemical messengers.
Imagine that, like the one in the photo, your head is made of glass and that it were possible to record how fast and how bright the majority of surface lights in a particular area were flashing.
That's roughly what an EEG can achieve.
It's complicated in there, and anyone who says that they have a complete grasp of what is going on inside is lying!
...but we have a few clues to guide us.
We can use an EEG to record the voltages that are present near the surface of various areas of the brain.
Essentially, an EEG is a volt-meter recording the voltages that escape to the surface via adhesive electrodes glued to the skin.
Straight away, this is a limitation because we are therefore oblivious to the voltages that are buzzing away in deeper areas of the brain and multi-lead EEGs can look at many areas of the brain at the same time.
However, we are still able to deduce an awful lot from a single site EEG.
These are slowly coming onto the market for consumer use, one that I've had for a while is the X-Wave. It's a large headset with a single forehead electrode and an ear-clip. The voltage from your forehead is monitored and by comparing the signal pattern to a known pattern for either "concentration" or "relaxation" the attached computer is able to deduce whether you are in either of those mental states.
This is a neuro-feedback system. You can spend ages watching the flicking graphs and wiggling lines playing "trial and error" trying to make them respond as you wish. When you achieve the desired pattern you are given positive reinforcement by the computer, making it easier to achieve that state again. Oddly, being taught what to do is tricky, but given half and hour of experimentation you'll find that you soon pick up what to do.
With a little practice I was able to achieve 100% concentration...
;)
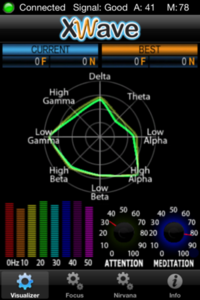
...and around 80% "Meditation" which isn't that easy when you are desparate to grab a screenshot of being "relaxed"...
There are also computer games written for the X-Wave which allow you to control them by either concentrating, or relaxing. A good "real world" example is the "Star Wars Force Trainer" where you wear a similar headpiece and try various thought patterns until you find the one that makes the ball float.
I first purchased the X-Wave because I thought it would help me to determine sleep stages if worn when asleep. It would have been an uncomfortable night as the headset isn't really condusive to a good night's sleep. However, it doesn't (yet) have the ability to record and playback data, nor does it (yet) allow you to see the raw waveform, although I believe that this is something in the pipeline, although this would still leave the user needing a knowledge of EEG interpretation to be able to determine which sleep stage a sleeper was in.
The XWave may be useful for games and biofeedback, but it wasn't able to do what I wanted, nor did the PC interface become available as was available for pre-order on the website.
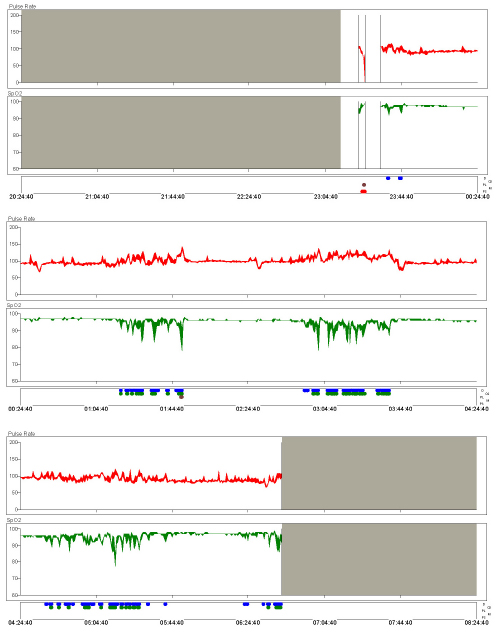
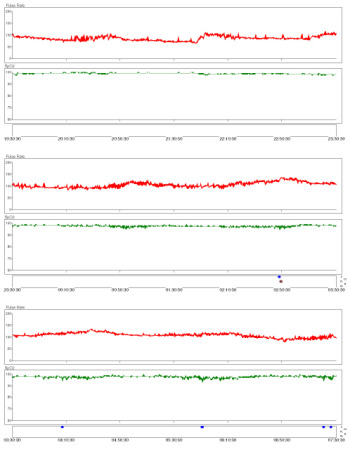
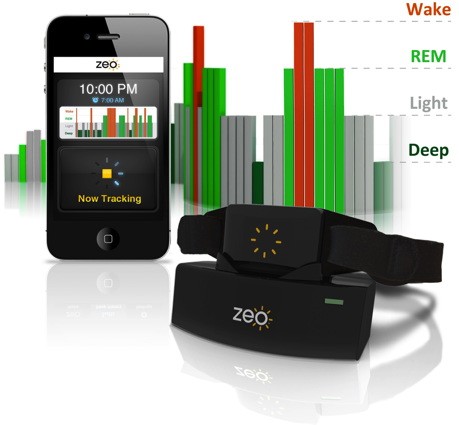
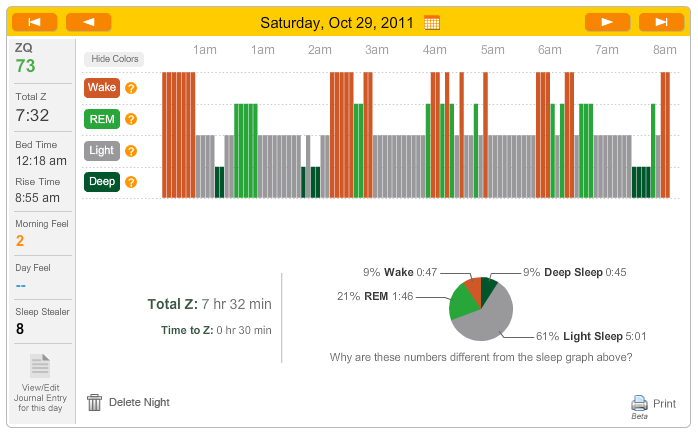
I then purchased the Zeo Bedside Sleep Monitor which uses EEG technology to do what I wanted (determine and record sleep stages automatically). Then, with updated firmware and a home-made lead, you can connect the Zeo to a computer and see an awful lot of what is going on in your brain. Granted, this is still a single channel EEG, so it is only looking at one area of the brain, but still the amount of activity that you can see is astounding!
First I'll mention some of the different types of brainwave that I've seen with this system. These waves are all recordings taken from my brain whilst I've been asleep.
;)
Generally speaking, the thing that determines one type of wave from another is its frequency (how many times it cycles per second), although some features jump off the screen at you such as "K-Complexes" and "Sleep Spindles", both features of Stage 2 NREM sleep.
It is possible that some features found in our brainwaves also serve a function, or at least they show when the brain is carrying out a particular function. For example, K-Complexes can be induced in a sleeping person by external noises. It is thought that the K-Complexes are a response to a noise that the sleeping brain has evaluated as not being a threat.
Sleep spindles also seem to be connected to the outside world. They represent when the brain is not consciously processing input from the world outside. In my oversimplified world I tend to think of them as little bundles of barbed wire that sit on the boundary of sleep and wake somehow shouting "La la la, we're not listening".
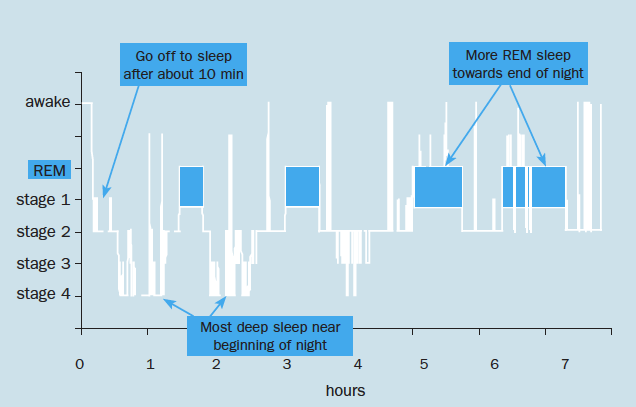
Like K-Complexes and Sleep Spindles, some wave patterns are closely related to sleep stages, such as Deep Sleep, which takes its correct name, Slow Wave Sleep, from the waves that are associated with it - Delta Waves, or Slow Waves.
Just as measuring the voltage from the screen of your television doesn't tell you what programme it's showing, measuring the voltage from your skull doesn't tell you what thoughts are being thought (although it's becomming ever closer http://www.ibtimes.co.uk/articles/290907/20120201/mind-reading-machine-scientists-computer-program-epilepsy.htm ) Trying to detmine what the person is thinking or dreaming about isn't as simple as looking at the brainwaves they produce and then comparing it to a vast dictionary of known squiggles. For one thing, the brain is capable of producing (and does so) many waves at the same time, in the same area of brain. The relative power of these waves can be separated out using FFT algorithms.
However, thoughts and sleep stages are completely different animals, and the Zeo is able to determine sleep stages with a high degree of accuracy (References Shambroom, Fabregas & Johnstone, also here and here), which is after all what it was designed to do. We are just piggy-backing off its ability to show EEG data.
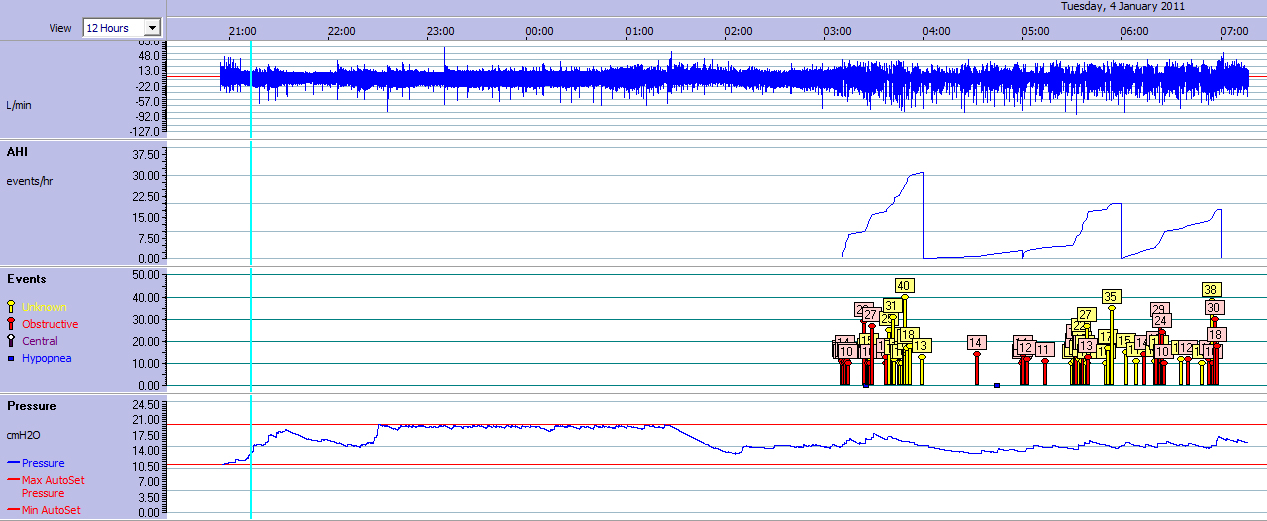
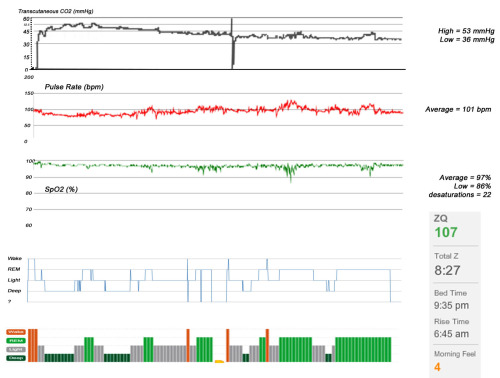
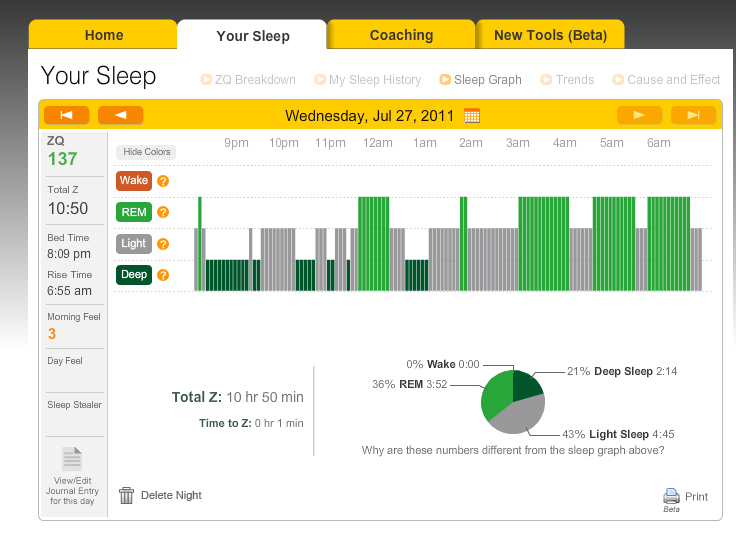
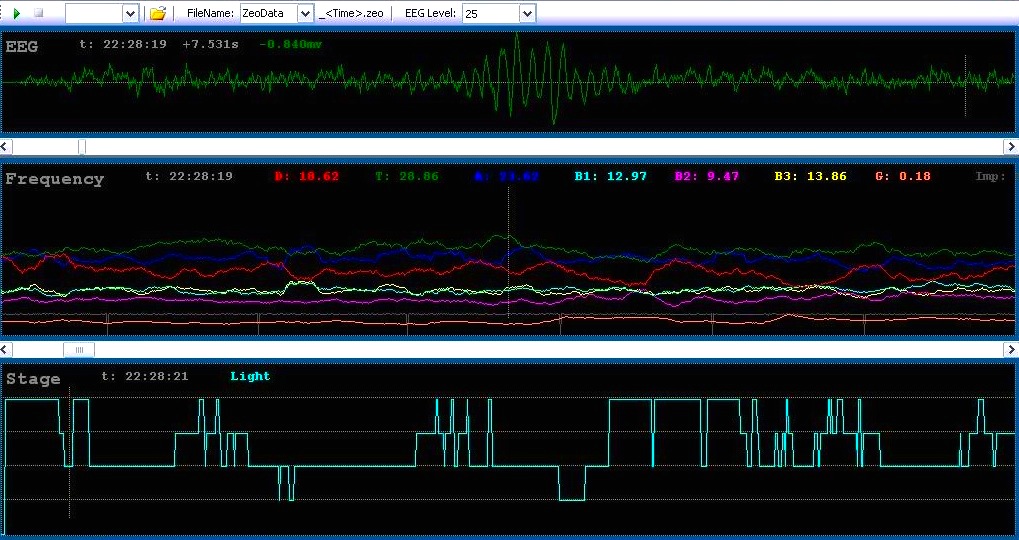
The following is the raw data from a section of sleep. The bottom is a hypnogram (shows the stages of sleep) for a whole night (top-bottom = wake, REM, Light, Deep); the top is the raw waveform for the current 15 seconds) whilst the line in the middle is a record of about 45 minutes of data.
The middle one is the result of the FFT analysis (mentioned above) and represents the types of waveforms in proportion to each other. From this it is possible to determine which is the dominant waveform.
A good example of this is observing the transition out of slow-wave sleep. (Note the steep drop in the red line).
;) Click for larger image
Click for larger image
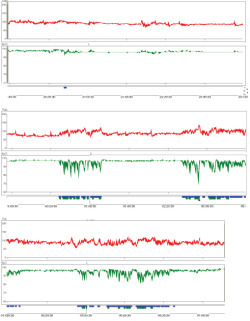
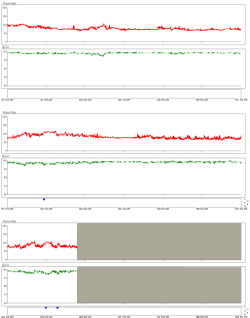
It's also interesting to see what happens to your brainwaves while awake and carrying out various tasks.
Normally, the frequency distributions seems to be fairly scattered (the lines are nicely spaced out), but one night I woke around 3am and couldn't get back to sleep, I kept the headband on. It seems that when I was concentrating on reading Twitter the various frequency brainwaves became more focused, leaving Alpha and Theta as dominant.
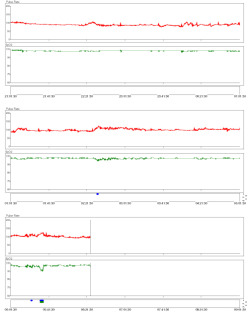
These grouped together even tighter when I actually tweeted and a form of Beta wave became dominant (although only slightly). I presume the tight grouping is because typing required more concentration and more focused thought. Oddly I received a phonecall while awake, and this shows another pattern.
;) Click for larger image
Click for larger image
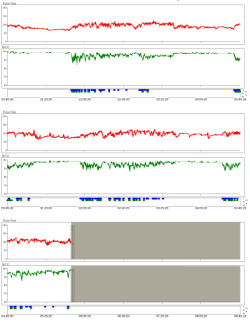
Through playing around with this set-up you learn to spot patterns. For example if I am disturbed in the night by a sound that wakes me you can see a brief period of concentration before I go back to sleep. it would be fantastic to actually see the change in brainwaves during an episode of sleep paralysis or a lucid dream.
This would make a great neuro-feedback system and I plan to use it to test the claims of various products that they are able to "induce delta waves" or "cause trance like theta waves" etc.
 Explanations, Monitors
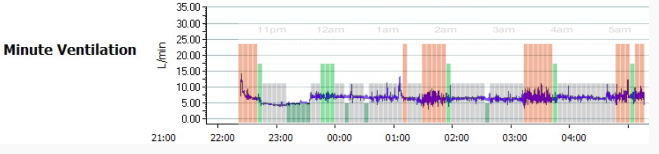


;)