Entries in Zeo (4)

Wednesday
Feb222012

Actigraphy: Only Part of the Story...

Actigraphy, or the monitoring and charting of the movement that we make, is an established means of monitoring sleep, albeit not a very detailed one.

The patient wears a movement monitor(s), the data from which is essentially processed as "not moving = asleep" and "moving = awake". As you can see, this can only really tell us the two states and not provide more accurate sleep stage information. 

Actigraphy is not a substitute for a full sleep study, however the data it provides can be used to augment a sleep study.

There are many consumer actigraphy devices on the market today, and also many intended for professional use. I am only concentrating on the consumer devices. The professional devices are a lot more sophisticated.

A few months ago I tried out a couple of the consumer devices myself, and pretty much dismissed them as I found that they didn't really add anything to my existing set-up consisting of nasal airflow, oximetry, capnography, IR camera and the Zeo.


First let's take a look at the devices and the data they provide:
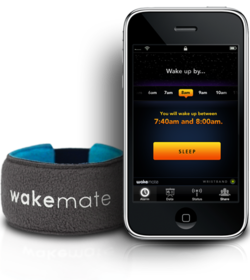
 The first device is the "Wakemate". This consists of a small circuit board that fits inside a wrist-worn sweatband.

The on-off switch protrudes directly from the circuit board, which had me worrying that it would soon break after repeated use, however it seemed secure enough once tucked inside the padded band.

Once paired with your smart-phone, the device uploads its data via bluetooth. 
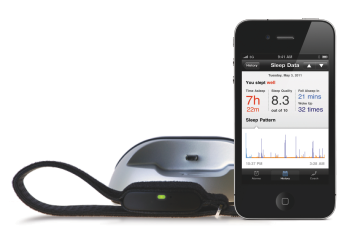


The second device is the "Lark".

This is similar to the Wakemate, although it felt sturdier and had a nice charger dock with it.

The electronics are encased in a sealed unit which is then inserted into the wristband.


 To give a fair test to these gadgets, I wore them both on the same night, both on my non-dominant wrist. Once I'd downloaded the data I was able to find a chart of time vs movement. Both charts aligned well:
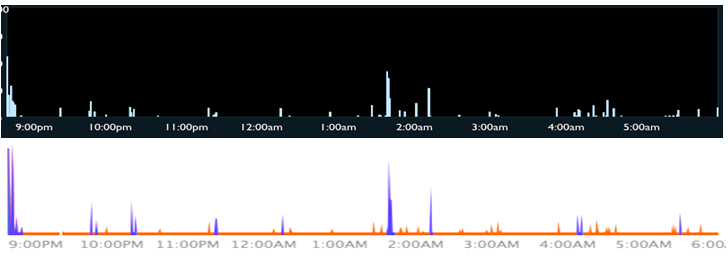
 (Wakemate - top. Lark - bottom)

The Lark's graph is more detailed than that of the Wakemate, and shows some analysis has already taken place on the data. It highlights large movements blue signifying periods of wakefulness and leaves smaller movement orange.

More data is available from both devices, such as total time awake, total time asleep, time in bed etc.

I then compared the above graphs with the Zeo hypnogram from the same night...
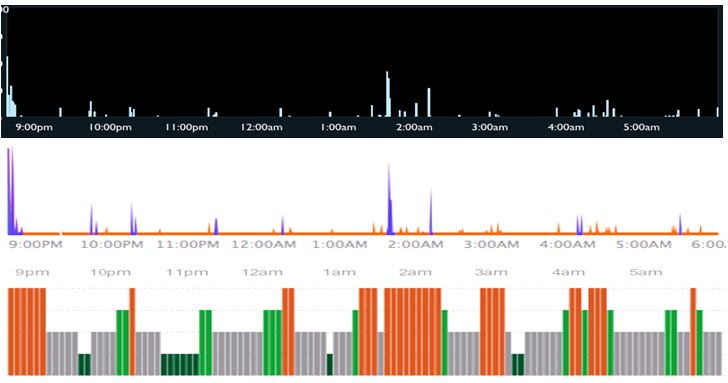
By doing this some of the limitations of actigraphy become clear. I was actually awake for an hour between 1:15am and around 2:15am. During this time I was lying still, hoping to fall asleep again. The actigraphy-based devices interpret this period of stillness as sleep, albeit with some movement. Being still does not equate to being asleep. Consequently, if a partner is moving around in the same bed as you, it is possible that the actigraphy would detect their movement. 

However, it was good to have my broken REM (around 4am) confirmed by the actigraphy devices. At this time I was suspecting that the Zeo was detecting some of my REM as wakefuness (a suspicion that I later ruled out). During normal REM sleep muscle atonia prevents us from moving, so seeing that I actually moved during REM added to the growing evidence that I really did wake during REM sleep.
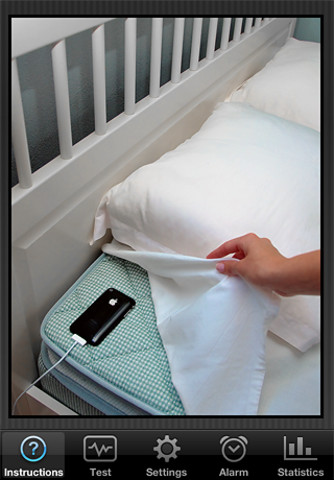
 

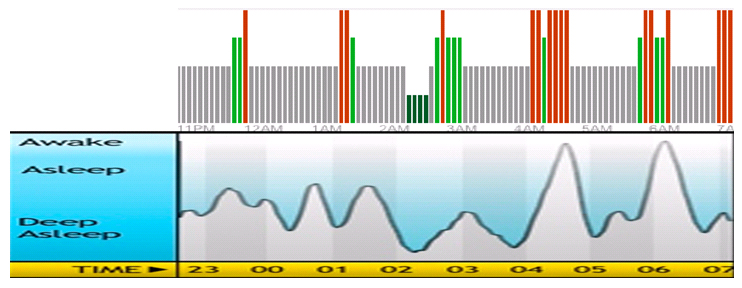
Whilst looking into actigraphy, I also found a popular iPhone app that makes use of the accelerometer in the phone. It's called Sleep Cycle.

The phone is placed at the top of your bed, near your head, it then monitors your movement (based on how the bed moves) in the night.


It's actually very simple, but I found that it was surprisingly accurate when compared to the Zeo. It correctly identified two periods of being awake and one period of deep sleep. I suspect in a healthy sleeper, it would confuse REM sleep and deep sleep.
 

I have also used the AxBo "SleepPhase" alarm clock. This is a clock that comes with two wristbands which wirelessly communicate with the clock. Each wristband contains a sturdy sealed module that detects movement. The intention is that two people can use this clock.

I purchased the AxBo before I had any other consumer devices. I still had the oximeter and the capnograph, but no Zeo and none of the actigraphy devices mentioned in this blog-post.

However, after purchasing the clock and using it for one night, I realised that it doesn't actually show sleep stages. I probably should have realised beforehand. 

The sensors are actually very sensitive, and show more movement information than anything I've previously discussed here. They can actually show which axis the movement takes place along. However, after a couple of nights of wearing the band and looking at my movement data I thought "Okay, but so what?". I wasn't actually sure where to go from there as I wasn't interested in the clock's ability to wake me up at an optimal time, more in its ability to chart my sleep.

A device for sleep and wake?
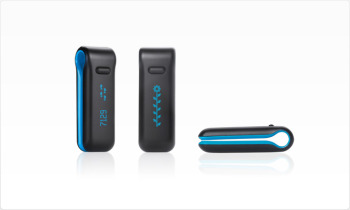
As part of a health kick (and weight loss), I have been using a device called "FitBit". It looks like a very slick pedometer, but it is acutally a lot more sensitive. It uses an accelerometer to determine steps taken in day, how many flights of stairs you climb, how many calories burned, and sleep-actigraphy similar to the devices mentioned above.

The difference between this and a standard pedometer is that this can show you, in graph form, when the activity occurred during the day.

The bonus with the FitBit is that the "FitBit Dashboard" lets you link your data with other "Quantified Self" devices such as the Withings bathroom scales, which in turn lets you link your data with your Zeo ZQ. 

This all adds up to a feeling of being part of a bigger programme, a programme that encourages you to look at all aspects of your health see the effect that lifestyle changes have on your data (and on you). You can actually quantify your exercise, which in turn reveals a greater weight-loss which hopefully will have an effect on my sleep quality, which will be seen in the ZQ.

Anyway, I've lost 9lb so far and I plan to carry on until I get down to my target weight and then I'll blog the combined results.

Quantifying the exercise that I do in terms of steps taken, flights climbed and calories used should allow me to see a correlation between FitBit exercise and Zeo deep sleep, maybe a correlation with sleep and a quantified "power-down hour" in the evening; who knows, it may even reveal a REM correlation too.

How did FitBit do when compared to Zeo for sleep analysis?


Again, it compared well, with the exception mentioned above (that being still in bed does not equate with being asleep), and to be fair, the Zeo 30 second data does show me drifting into and out of sleep at a couple of points in the large period of wakefulness at the end before I eventually gave up and got out of bed, but for the most part I was awake and just being still.

However, none of the actigraphy devices show sleep-stage data, and (as I'm learning from the fascinating "Quantified Self" movement) more data means a greater ability to "hack" yourself or to help yourself.

By using actigraphy as the sole gauge of good sleep you are blind sleep stage data. Having access to my sleep stage data allows me to target specific stages that I think need attention: If your slow-wave-sleep (deep) is too low then you can exercise to increase it. If your REM is broken or too low then you can try supplements and mental exercises to put it right. This is not possible if you can only tell that you were moving when you were supposed to be asleep.

Having easy access to my sleep stage data set me on the road to investigating why my REM sleep was broken. I was easily able to correlate my drop in oxygen levels to REM sleep using a cheap pulse-oximeter, and from there, with the addition of another channel - airflow, discovered that REM-related apnoeas were the cause. From there with the addition of another channel (motion activated IR camera) I was able to add "positional" and "obstructive" to that diagnosis. Giving me the full diagnosis of "Mild REM-related positional obstructive sleep apnoea".

With a correct diagnosis, I was then in a better position able to properly assess treatments (more of those in a later blog).

This would not have been possible had I only known that I moved during my sleep as the correlation with REM would not have been detectable, although, to be fair,I could have gone onto diagnose apneoa without sleep stage data, it would have not given me the full picture. In fact looking at my sleep using only actigraphy (when I only had the AxBo), made me pretty much give up after a couple of nights. Nothing made me want to look into my sleep further until I had the Zeo and Oximetry data.

I continue to use the FitBit during the day, but I eventually consigned the other sleep-actigraphy gadgets to the bottom drawer until I realised that by using these devices slightly differently that I could use them to add additional channels to my setup, in theory anyway...

A cause of poor sleep is Periodic Limb Movement Disorder, in which the sleeper's legs twitch and move involuntarily during the night, causing them to wake up, or partially wake up (micro-arousal), both of which lead to disturbed sleep. 

By fixing the actigraphy devices to the sleeper's ankles it would be possible to detect this. It might even be possible to detect the leg movements as a cause of waking up, rather than as a consequence of it if the devices could be accurately synchronised. The only thing that concerns me about this is that the timescale on the axis of the movement graphs may not be detailed enough to show the movements occuring before an awakening. Oddly, I think the Axbo would be best suited to this, as the software allows the most flexibility in analysing the data. However, this will have to remain a theoretical test as I don't have an issue with PLMD.


(All device photos are from product websites unless indicated)

Wednesday
Dec212011

Non-Invasive Ventilation 

I could rehash the many excellent write-ups of non-invasive ventilation (NIV) that already exist on the internet, but I thought it would be more personal for me to tell how my son came to use it, explaining NIV along the way...

Bear in mind that these events took place over a period of 10 years and involved many medical professionals from various hospitals and clinics, although it may read as if it took just a few nights. 

A person's breathing might not be enough to sustain them for various reasons including:

  • Illness (short term or long term)
  • Injury (critical phases)
  • Neuro-muscular issues

Sometimes a person will need respiratory support during these times. Sometimes it can be for a short while whilst in intensive-care or a high-dependency unit, other times it can be a life-long need, in which case they will likely have to have a tracheostomy tube fitted in order to leave their face free and unobstructed.

There are also people who only need respiratory support whilst they are asleep.

Due to changes in our respiratory drive and how our muscles respond during sleep our breathing undergoes many changes, this can even vary depending on the stage of sleep we are in. 

The following graphs contain information about how much air I was breathing per minute during the various stages of sleep (as scored by Zeo)...


I won't go into great detail about the why here, instead I want to concentrate on what can be done about the problems that these changes can cause.

At the time of writing, there is a good Wikipedia article about these changes entitled "Sleep & Breathing" 

When he was first paralysed, my son was on full time ventilation. This was considered to be a long-term and possibly a life-long situation and he was give a tracheostomy tube (a tube inserted through an opening in the neck and directly into the windpipe) to allow the ventilator to be connected to him.

10 years on, he is still paralysed but fortunately after several months of being in hospital the tracheostomy tube was able to be removed because the higher part of his spine had partially recovered. He had been slowly weaned off ventilation.

After the tube was removed his oxygen levels were continuously monitored and it was discovered that his oxygen saturations plummetted when he was asleep, but they always picked up again. We left hospital with a pulse-oximeter (a device that monitors pulse rate and blood oxygen saturations via a finger probe).

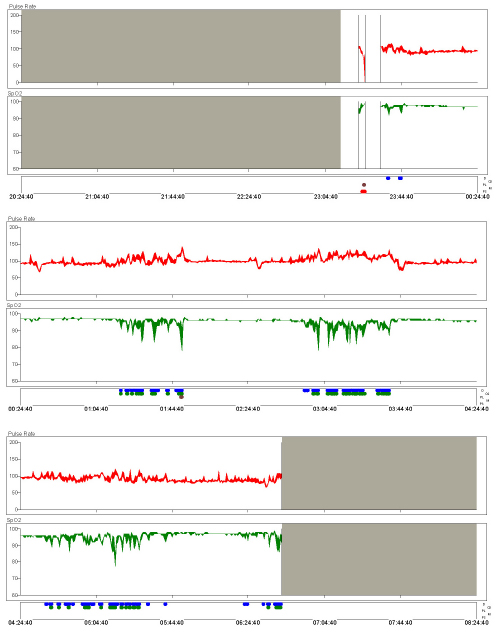
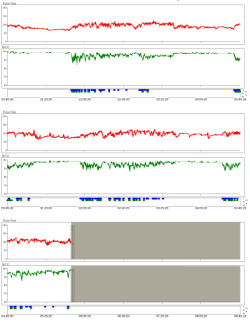
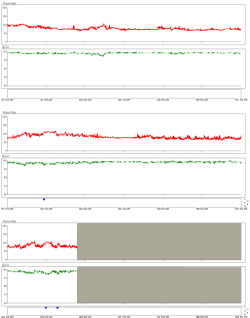
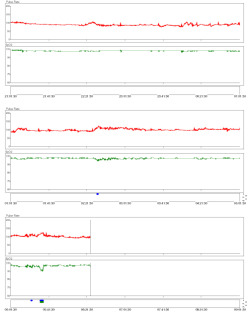
On some occasions his levels dropped as low as 65% (Generally speaking most people maintain a level of >92%). It was this that prompted me to buy the equipment to record his oxygen saturations so that I could show the relevant doctors involved in his care. Although, not a chart of the lowest that he dropped, this is a chart from early on (right) that is a good guide to what used to happen.

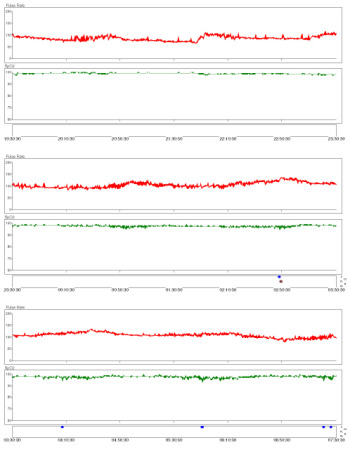
Each row is 4 hours of data (grey parts are when the machine was not monitoring due to him being awake).

Red = heart rate (bpm). Green = oxygen saturations (%) 


Left: How the chart should appear (taken from a fairly recent night when he was breathing oxygen via a mask)

 Right: His chart from a typical night


So why not just use oxygen, if it makes the graph all straight and pretty?

Well, oxygen is only one of the gasses involved in breathing, granted it's an important one, but Carbon Dioxide is also involved.

At school we were all taught that we breathe in air, use the oxygen then exhale carbon dioxide, but the carbon dioxide actually serves a purpose. It is used as a trigger to breathe. When the levels rise to a certain level, we breathe to remove the CO2.

If the "sense and control" mechanism in the brain is damaged, or if the muscles are not able to respond to its signal to breathe, then CO2 can build up in a condition known as hypercapnia.

That is what was going on while my son was using oxygen. We were able to see this by the use of a split cannula. It looks like a standard nasal cannula for oxygen delivery, but the tube to one nostril is used to deliver oxygen whilst the other is used to monitor the CO2 using an end-tidal CO2 monitor / Capnograph.

High CO2 can lead to other health issues, and it actually affects the Ph of your blood.

So my son was trialed on a type of ventilation known as Continuous Positive Airway Pressure (CPAP). This involves a constant pressure of air being delivered into your nose (or nose and mouth) via a mask. 

If you ask a child to blow a balloon up, then they will probably struggle, but if you "do the tricky bit" and start it off for them then they will probably be able to top up what you've started and finish inflating the balloon.

That's essentially the idea of CPAP. The airways are kept open by the pressure, leaving the user the task of inflating their lungs.

CPAP can be a great help when people suffer from Obstructive Sleep Apnoea. It can prevent the airway closing off, thus allowing the sleeper to breathe normally.

However, CPAP wasn't preventing my son's apnoeas.

This could have been because he needed much higher pressures, or because the apnoeas were "central" and not "obstructive" in nature.

A central apnoea is where the brain doesn't tell the sleeper to breathe.

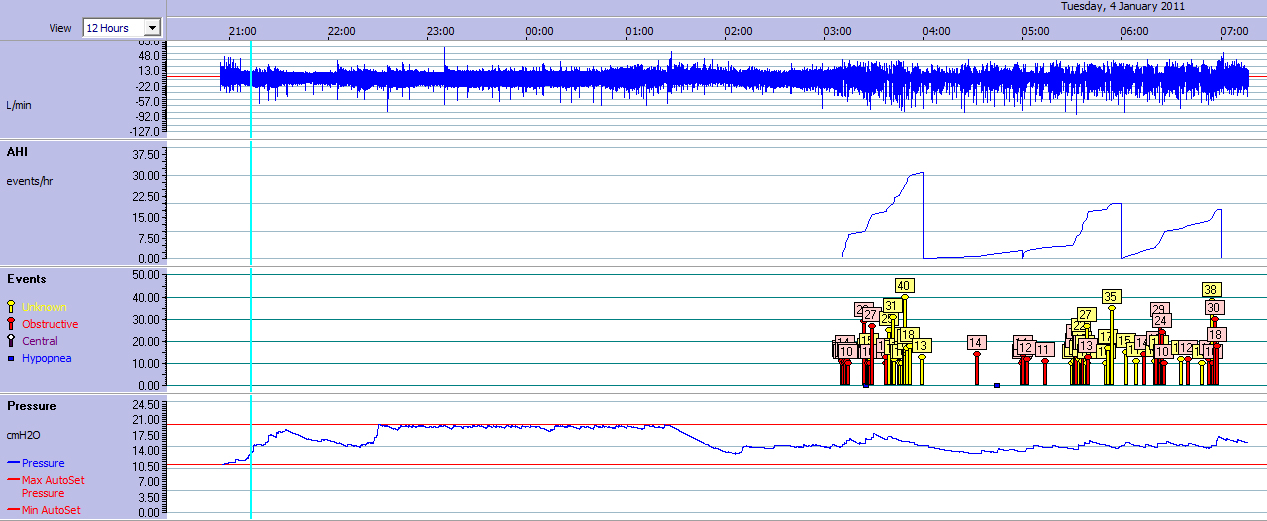
Fortunately, the CPAP machine records the overnight data to an SD Card and can decide whether the apnoeas are obstructive (airway closed) or central (airway open but no flow).

It showed that he had mainly obstructive apnoeas with hypopneas, but also the odd central apneoa, along with many apnoeas tagged as "unknown".

The night above shows them towards the end of the night. This didn't fit with the pattern of oxygen desaturation that we saw begin around an hour after sleep onset, even whilst on CPAP, hence we weren't sure how much to trust the detected central apnoeas as they seemed few and far between. However, if someone has both obstructive and central apnoeas, CPAP can reveal those central ones after it has removed the clutter of obstructive apnoeas

The CPAP that he was prescribed was "Auto-titrating CPAP" this means that the machine decides which pressures are needed. You can see this in the graph above (the pressure line varies throughout the night). Intriguingly, the when the pressure is the highest there are no apnoeas, but he still desaturated.

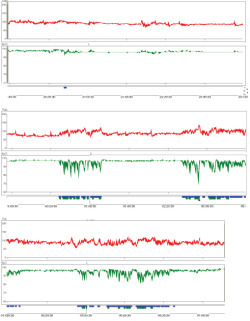
The auto-pressure function can be set to choose between limits, or forced to give a constant set pressure. After many nights of alarms. We obtained a chart from a night at 6cmH20 (left) and a night at 15cmH20 (right) to see what was going on.


 6cmH20 had little effect. 15cmH20 was better, but still unacceptable and uncomfortable for him.

He would wake in the middle of the night and not be able to call out due to the mask over his nose and mouth. His heart rate would then increase and his alarm sound to alert me. I'd have to turn the CPAP off and it would have to be re-ramped again (start at a low pressure and build up over time, hoping that he was asleep before it delivered high pressure again). 

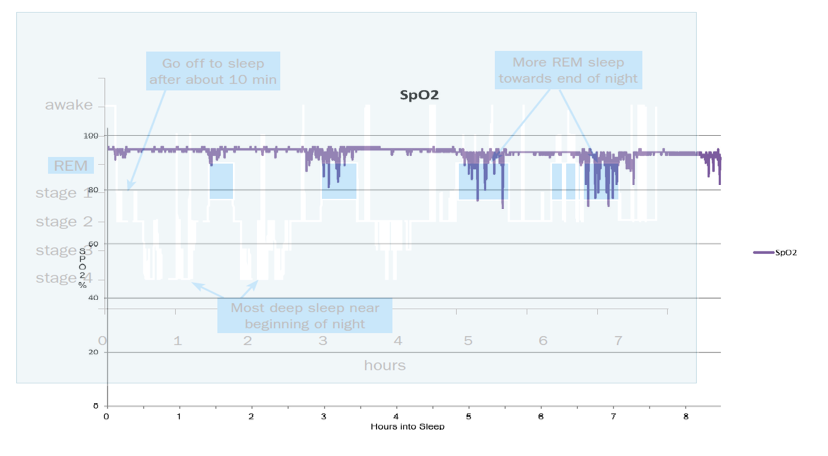
Because his blood-oxygen only dropped at certain times of the night rather than be low ALL night it was suspected that it had something to do with a particular stage of sleep. Below is a picture of a normal hypnogram (a graph detailing the stages of sleep, as shown on the Zeo entry of this blog) overlaid with a graph of his oxygen levels from one night.

Seeing this was a goosebump moment...

The pattern of his oxygen desaturations matched up really well with a standard hypnogram, so it was pretty certain that his condition was REM related. However, this wasn't a graph of his REM.  A way of working out and recording when he was in REM was needed.

New equipment was also needed...

Due to the possible presence of central apnoeas, it seemed unlikely that CPAP was going to be an effective solution, afterall there is little point in keeping the airway open if the brain isn't initiating a breath (or the muscles aren't able to respond to the signal to breathe). It was suspected that he would need Bi-level ventilation. Well known brand names for this are BiPAP and VPAP.

These are both Bi-level Positive Airway Pressure devices. Bi-level delivers two alternating pressures. The higher one is the IPAP (Inspiratory Positive Airway Pressure) and the lower one is the EPAP (Expiratory Positive Airway Pressure). The IPAP is essentially the breath, while the EPAP is the amount of pressure required in order to keep the airway open. Usually the breaths are triggered by the sleeper's breathing efforts, but to cover the possibility that he did indeed also have central apnoeas we used a BiPAP machine that could also be set to deliver "backup breaths" if my son didn't breathe a certain number of times a minute.

The CPAP / BiPAP was delivered via nasal pillows. These are fantastic as they allow the user to speak whilst using them. However, this left us with no way of being able to reliably monitor his CO2 using a capnograph.

CO2 monitoring is essential, without this it would be too easy to adjust the ventilator so that there were no oxygen desaturations, but actually be hyperventilating him, or worse causing trauma to his lungs and airways; so unless we could find a way to reliably monitor his CO2 we couldn't go any further. A different type of CO2 monitor was bought in...  A transcutaneous CO2 monitor.

The transcutaneous CO2 monitor gathers its data by way of a probe that is attached to the skin of the chest or arm. It then heats up the skin and evaluates the gasses given off. The probe needs to be removed after several hours and placed on a new site in order to reduce the risk of probe burns to the skin.

The titration process wasn't a one night affair, so we had the luxury of being able to record readings at home between appointments. However, at home we didn't have an EEG machine to record brainwave data, so we couldn't tell what stage of sleep he was in.

We needed to see when (and if) he achieved REM sleep while his settings were adjusted over the course of several nights. We also needed to make sure that the pressures weren't waking him up. Afterall, if he didn't have much REM (or his REM was disturbed) then his oxygen levels would look good and give the false impression that the settings were working. The Zeo was perfect for this.

This graph is from one of the first nights of BiPAP (when the settings were good but not optimal) and it shows a great correlation between his oxygen desaturations and Zeo's calculations of REM sleep. (The dips in the green oxygen line are a near perfect match for the green chunks of REM from Zeo), as are the rises in pulse rate and CO2.

This gave me a lot of confidence in the Zeo's decisions as REM is probably the hardest state to detect due to its similarity to being awake. In fact I'd even feel confident enough to say that the piece of missing data from the Zeo (headband was too loose) would have shown REM.

The result of a few nights adjustments during REM was that BiPAP at the correct pressures eliminated his oxygen desaturations completely and allowed him (and me) to sleep all through the night for the first time in a very long time.

It turned out that obtaining a machine that could provide additional "backup" breaths was a good investment... Pressures alone weren't enough to prevent his oxygen levels dropping, so a backup-rate was set of 13 breaths per minute.

This meant that if he didn't breathe 13 times a minute of his own accord, that the machine would make up the number of breaths. 


The graph on the left is with BiPAP pressures set to 18/10. This was fine for his oxygen requirements, but it still was uncomfortable for him (but tolerable). The high EPAP of 10cmH20 made it hard for him to exhale (remember that he has neuro-muscular issues).

The pressures were re-titrated but this time with a lower EPAP. This seems essential for him to be able to exhale effectively, and provides a more comfortable night.

These settings will be reviewed periodically by the medical professionals that have been involved in his care to see if they are still optimal.

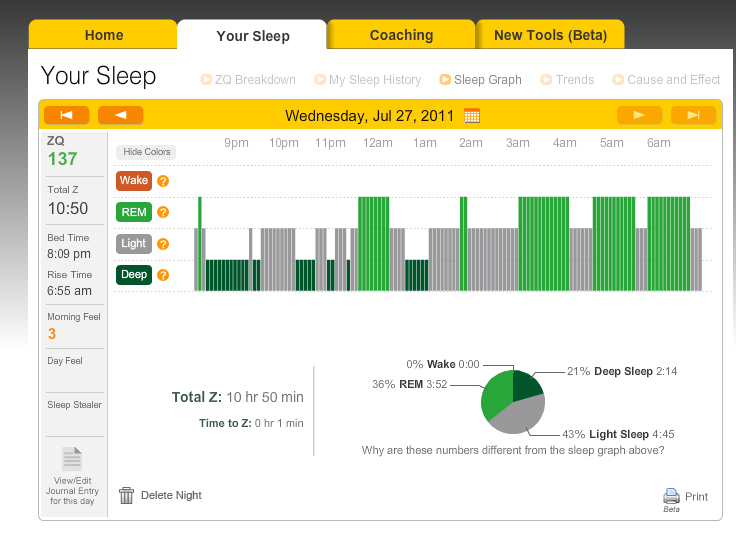
He now loves the BiPAP machine and doesn't like sleeping without it, he doesn't sleep in until noon at the weekends, he doesn't fall asleep at school and can stay awake until long into the evening. He also has a ZQ of 137 which he likes to use to mock my awful average ZQ of 68.


Thursday
Nov102011

Zeo & CPAP / BiPAP

I've posted on a couple of CPAP boards (and read at more) and it's clear that there are a lot of us who like to see what the ventilators are doing overnight and how many apnoeas & hypopneas there are. Quite a few of us own pulse-oximeters too, so this data can also be included.

One problem is that each device has it's own printout making comparing them tricky.

I created an A4 page in Photoshop and found that it was then easy to align all the graphs as long as all the monitors were were started and stopped at the same time (or as close as you can manage).

You can either print all the various outputs to PDF files using either Adobe or the free CutePDF then open them in Photoshop or you can take a screenshot from each piece of software.

Then cut and paste each graph onto your A4 blank and stretch them so that the start and stop times align.

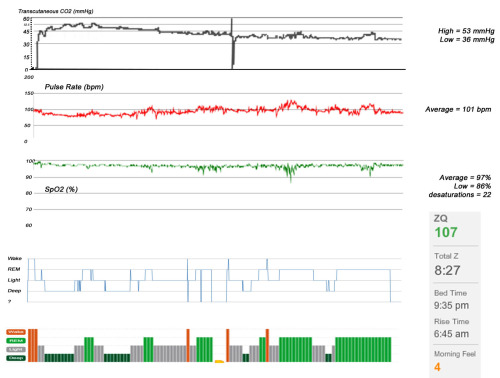
Below is an example of one from a night of my son's BiPAP data. 

It includes: 

  • BiPAP output (Pressure, RR, flow rate, triggered breaths, apnoeas etc)
  • Transcutaneous CO2 (actually a reprocessed photo of the onboard graph)
  • Oximetry trend
  • Pulse rate
  • Zeo 30 second resolution hypnogram
  • Zeo 5 minute resolution hypnogram


I then pasted bits of relevant data from Zeo and the oximeter around the edge.

This is from a night of making adjustments to the backup rate of breaths and is a good example of what aligning the data can reveal.

Take a look at the highlighted strip and work down from the top...

  • The backup rate had been increased a couple of hours before. 
  • Then in the highlighted part you can see that the number of breaths increased even more.
  • However, there was a much higher increase in the number of breaths he was doing for himself

Why?

When you look down to the Zeo hypnogram it becomes clear. The extra breaths were waking him from sleep, hence his spontaneous respiratory rate increased even more.

The backup rate was too high, so I reduced it.


I have also tried the Zeo with CPAP on myself.

Here is a simple overlay of the Zeo hypnogram onto the ResScan report. (I pasted the hypnogram into a new layer in Photoshop and then made it semi transparent).

A correlation between minute ventilation and periods of being awake (actually broken REM according to the 30 second hypnogram) is easy to see.

Also the apnoea flags point to me losing deep sleep due to apnoeas.

More about that and what I plan to do about it in another post though.

Sunday
Nov062011

Zeo Sleep Monitor

In many blog-posts I'm going to be talking about some devices that I use to monitor my sleep. So I thought it best to explain a bit about them. The first one is the Zeo.

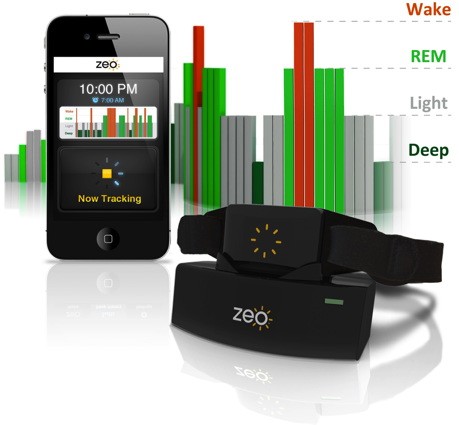
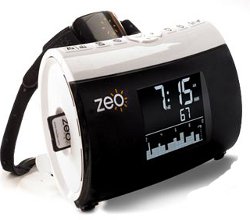
There are two flavours of Zeo, a bedside unit and a new mobile version that pairs with your smartphone.


 Both devices consist of a wireless headband containing fabric electrodes which are used to measure your brainwaves using EEG technology. Previously EEGs were confined to sleep laboratories and hospitals. They involved gluing electrodes onto your scalp and connecting them to a computer in order to detect the voltage changes that take place in your brain. Interpreting these EEGs is a skill in itself.

During a full polysomnography sleep study, a sleep technician will manually look at each 30 second chunk of data (epoch) from the EEG (then combine it with data from what your eyes were doing and how tense your muscles were) in order to determine which stage of sleep you are in. Zeo is much neater and doesn't involve glue or wires.

A typical night with Zeo goes something like this:

  • When you are ready to sleep, remove the headband from it's magnetic dock/charger
  • Place the headband on your head with the block roughly central on your forehead
  • Wait for the little symbol of a head to illuminate (that means it has detected a brainwave pattern - always a relief)
  • Sleep
  • Wake, remove and re-dock headband

Both versions allow you to instantly see how you slept last night but you can also upload and view the data via the Zeo website. The site allows greater analysis of how you slept; you can also complete a sleep journal detailing coffee and alcohol intake, your "morning feel" and various other factors to help you see a cause-and-effect relationship between them and how you sleep.

A device that reads your brainwaves... you know you want one. This is where you can get them from in the UK: http://myzeo.co.uk/

So, what does the Zeo actually measure?

As previously said, it uses an EEG, combined with an EOG (eye movements) and EMG (muscle tone) to determine which state of sleep you are in. It then presents this to you in a colourful graph called a hypnogram.

Whereas a sleep technician looks at every 30 seconds, Zeo examines every second of data and makes a decision, it then amalgamates these into 30 second chunks using a proprietary scoring system.

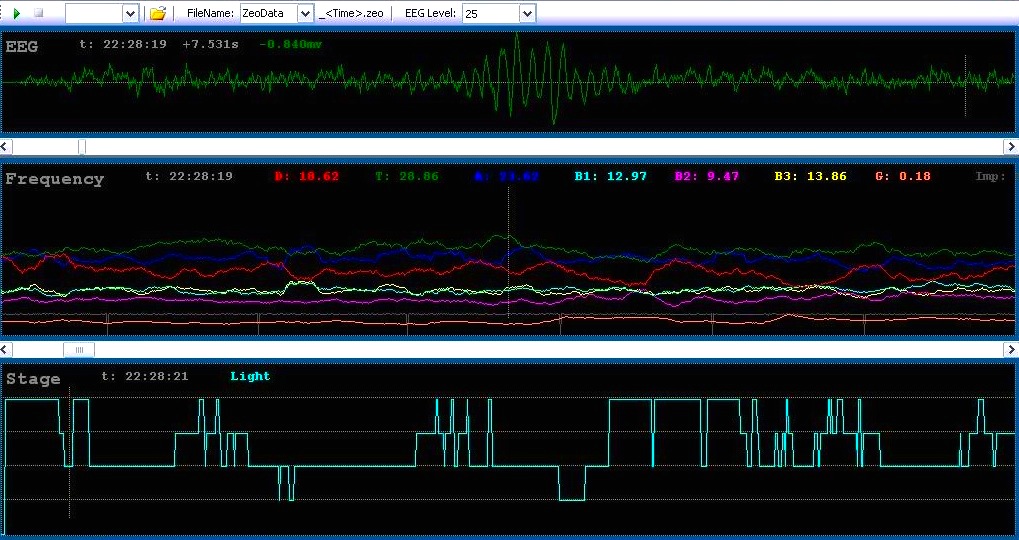
The makers of Zeo have released a special firmware for the bedside unit that allows you to plug a computer into the port on the back and see the actual EEG and play it back in the morning. You can see all the little blips and squiggles and how they relate to your sleep.

 This, for example, is a "Sleep Spindle" it signifies that I was in stage 2 sleep...

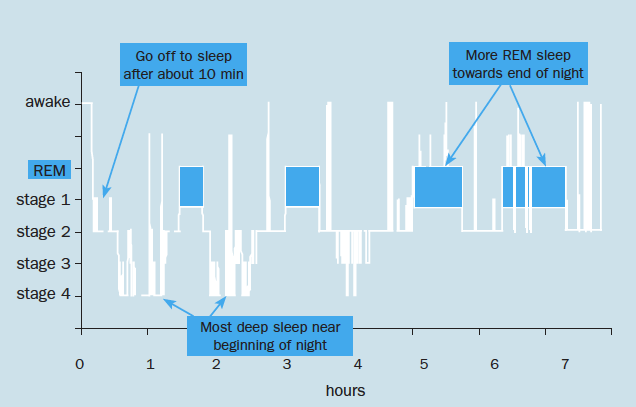
Sleep consists of cycles of deep, light, wake and REM (Rapid Eye Movement). On a formal hypnogram you may see these listed as an N and a number. The N simply means Non-REM. N1 and N2 are considered to be light sleep. N3 (and sometimes N4) are considered to be deep sleep.

Early in the night is when you get the most deep sleep, which then decreases through the night and is "replaced" with increasing amounts of REM

 Hence, a normal hypnogram (sleep stage graph) should look something like this:

Graph taken from "A good night's sleep part one: Normal Sleep" by Dr Sue Wilson.
"Nursing & Residential Care", November 2008

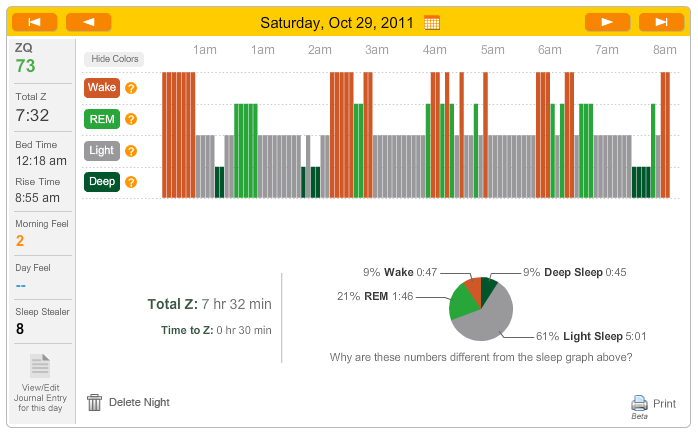
Zeo's hypnograms display data at resolution of 5 minutes. The 30 second resolution graph is available by exporting the data into a spreadsheet program.

This is one of my recent hypnograms from Zeo, and as you can see it's a mess...

That's where the Zeo's journal comes in... WHY is it a mess? Too much coffee in the afternoon? Too much wine in the evening? Is the room too warm? Do I always wake up at the same time in the night? Why is that? Could it be the heating making noises? etc etc.

By looking at the patterns, you can aim to work out why your night is disrupted (if it is). If you are one of the lucky ones who seem to sleep normally then you can aim to improve on that sleep to make sure you feel bright and energetic in the mornings.

What's wrong with my graph?

Looking at the the night shown above, there are a couple of things that jump out:

  • Deep sleep - not enough of it, and doesn't follow the pattern of decreasing through the night. This is clear because my body obviously tried to catch-up on deep sleep at 7:30am!
  • I have WASO (Wake after sleep onset), but it seems that they are not random, they seem to be clustered around what should be solid chunks of REM. 

These REM disturbances are what I believe leads to episodes of sleep paralysis. I will do a blog post on that later, but there is a good article on Wikipedia about it here: http://en.wikipedia.org/wiki/Sleep_paralysis

So all in all, much to improve on.

I did suspect that I had REM related issues. Maybe a small part of my son's condition is hereditary? Maybe not, maybe it's just coincidence.

For the 10 years that it took to get my son's sleep and breathing under control I was forever listening out for his oxygen alarm. He would stop breathing during REM sleep and the alarm would sound to alert me to it.

I'd then wake up, glance at the alarm on the camera that I'd installed and then go in to rouse him from sleep and get him to breathe again.

This would happen many times a night. Children have a lot of REM! 

Maybe in some way my brain had adapted to not be quite asleep, forever on the lookout for my son's alarm that everyone else in the house slept through (including him)!

My son's breathing is now regulated by BiPAP (A breathing machine that delivers alternating pressures of air via a mask - more about that in another post). That started about 6 months ago, so I thought I would have settled down into a decent sleep routine now. 

I decided to explore and used some of the cameras and monitors that I had used for my son on myself. After a couple of nights I now have a fair idea of why I wake in REM. So, I've decided to be a bit more disciplined about collecting data and recording what I'm up to.

This week I'll be gathering data for 5 nights (Mon - Fri) and will post the data and its mean as a baseline for my sleep, then I am going to try a different method of "fixing it" every 5 nights (Mon - Fri) and average for consistency.

I'll blog the results as I'm going along.

Next post: baseline sleep scores.