Non-Invasive Ventilation
I could rehash the many excellent write-ups of non-invasive ventilation (NIV) that already exist on the internet, but I thought it would be more personal for me to tell how my son came to use it, explaining NIV along the way...
Bear in mind that these events took place over a period of 10 years and involved many medical professionals from various hospitals and clinics, although it may read as if it took just a few nights.
A person's breathing might not be enough to sustain them for various reasons including:
- Illness (short term or long term)
- Injury (critical phases)
- Neuro-muscular issues
Sometimes a person will need respiratory support during these times. Sometimes it can be for a short while whilst in intensive-care or a high-dependency unit, other times it can be a life-long need, in which case they will likely have to have a tracheostomy tube fitted in order to leave their face free and unobstructed.
There are also people who only need respiratory support whilst they are asleep.
Due to changes in our respiratory drive and how our muscles respond during sleep our breathing undergoes many changes, this can even vary depending on the stage of sleep we are in.
The following graphs contain information about how much air I was breathing per minute during the various stages of sleep (as scored by Zeo)...
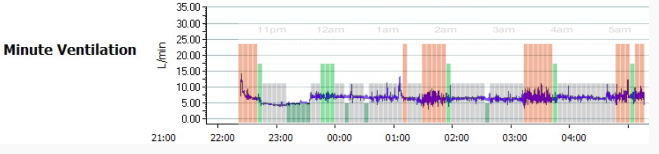
I won't go into great detail about the why here, instead I want to concentrate on what can be done about the problems that these changes can cause.
At the time of writing, there is a good Wikipedia article about these changes entitled "Sleep & Breathing"
When he was first paralysed, my son was on full time ventilation. This was considered to be a long-term and possibly a life-long situation and he was give a tracheostomy tube (a tube inserted through an opening in the neck and directly into the windpipe) to allow the ventilator to be connected to him.
10 years on, he is still paralysed but fortunately after several months of being in hospital the tracheostomy tube was able to be removed because the higher part of his spine had partially recovered. He had been slowly weaned off ventilation.
After the tube was removed his oxygen levels were continuously monitored and it was discovered that his oxygen saturations plummetted when he was asleep, but they always picked up again. We left hospital with a pulse-oximeter (a device that monitors pulse rate and blood oxygen saturations via a finger probe).
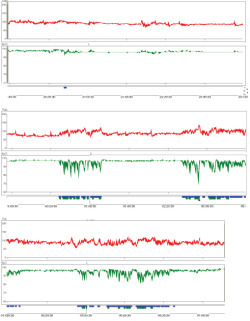
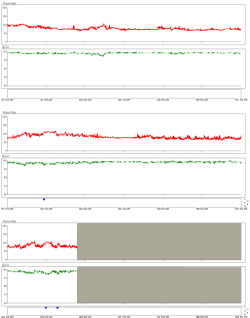
On some occasions his levels dropped as low as 65% (Generally speaking most people maintain a level of >92%). It was this that prompted me to buy the equipment to record his oxygen saturations so that I could show the relevant doctors involved in his care. Although, not a chart of the lowest that he dropped, this is a chart from early on (right) that is a good guide to what used to happen.
Each row is 4 hours of data (grey parts are when the machine was not monitoring due to him being awake).
Red = heart rate (bpm). Green = oxygen saturations (%)
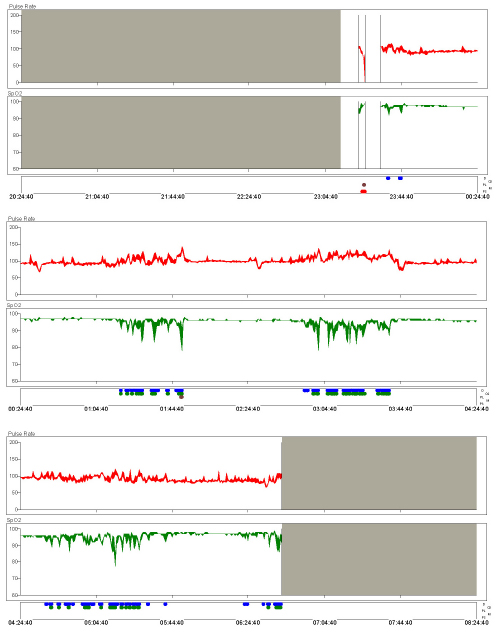
Left: How the chart should appear (taken from a fairly recent night when he was breathing oxygen via a mask)
Right: His chart from a typical night
So why not just use oxygen, if it makes the graph all straight and pretty?
Well, oxygen is only one of the gasses involved in breathing, granted it's an important one, but Carbon Dioxide is also involved.
At school we were all taught that we breathe in air, use the oxygen then exhale carbon dioxide, but the carbon dioxide actually serves a purpose. It is used as a trigger to breathe. When the levels rise to a certain level, we breathe to remove the CO2.
If the "sense and control" mechanism in the brain is damaged, or if the muscles are not able to respond to its signal to breathe, then CO2 can build up in a condition known as hypercapnia.
That is what was going on while my son was using oxygen. We were able to see this by the use of a split cannula. It looks like a standard nasal cannula for oxygen delivery, but the tube to one nostril is used to deliver oxygen whilst the other is used to monitor the CO2 using an end-tidal CO2 monitor / Capnograph.
High CO2 can lead to other health issues, and it actually affects the Ph of your blood.
So my son was trialed on a type of ventilation known as Continuous Positive Airway Pressure (CPAP). This involves a constant pressure of air being delivered into your nose (or nose and mouth) via a mask.
If you ask a child to blow a balloon up, then they will probably struggle, but if you "do the tricky bit" and start it off for them then they will probably be able to top up what you've started and finish inflating the balloon.
That's essentially the idea of CPAP. The airways are kept open by the pressure, leaving the user the task of inflating their lungs.
CPAP can be a great help when people suffer from Obstructive Sleep Apnoea. It can prevent the airway closing off, thus allowing the sleeper to breathe normally.
However, CPAP wasn't preventing my son's apnoeas.
This could have been because he needed much higher pressures, or because the apnoeas were "central" and not "obstructive" in nature.
A central apnoea is where the brain doesn't tell the sleeper to breathe.
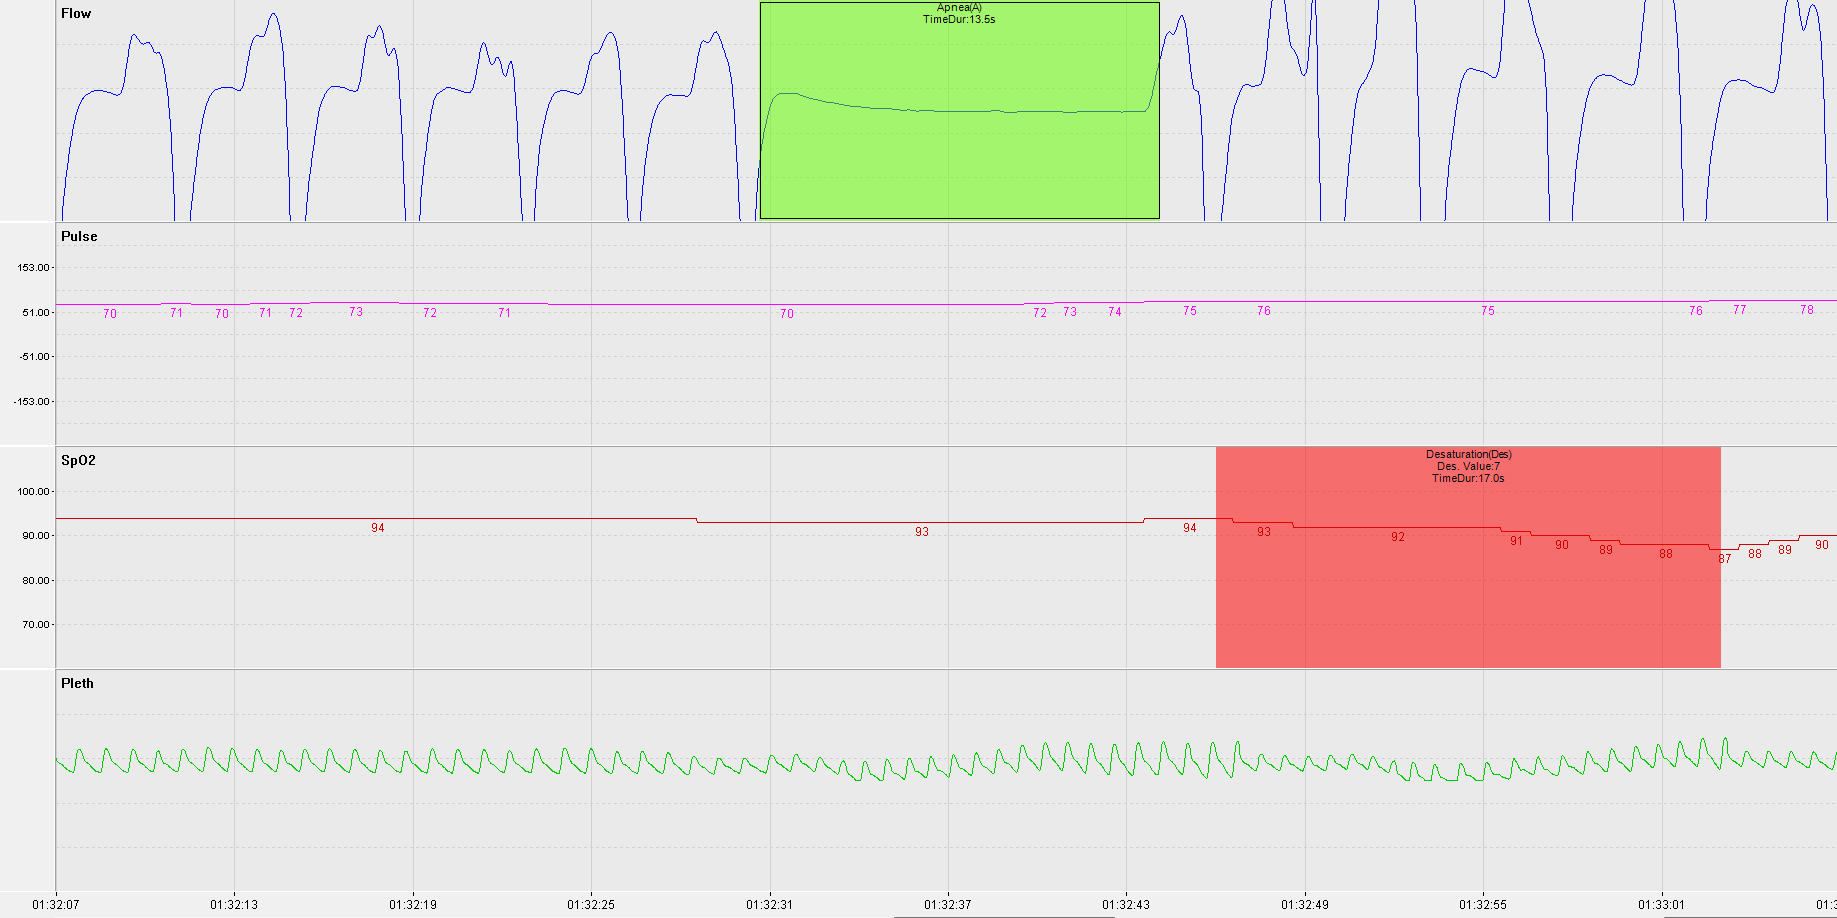
Fortunately, the CPAP machine records the overnight data to an SD Card and can decide whether the apnoeas are obstructive (airway closed) or central (airway open but no flow).
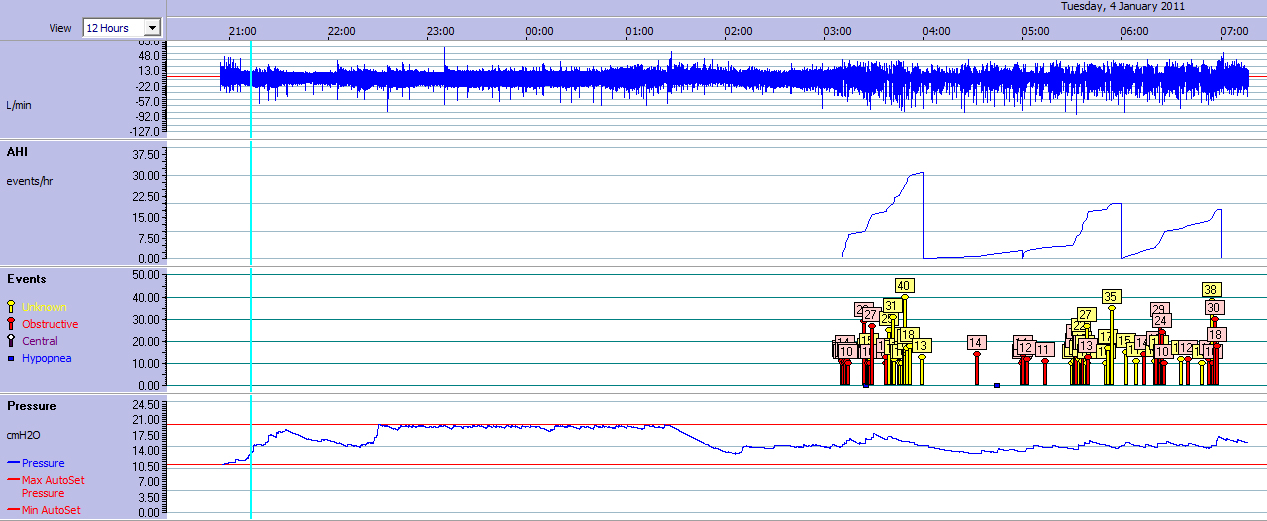
It showed that he had mainly obstructive apnoeas with hypopneas, but also the odd central apneoa, along with many apnoeas tagged as "unknown".
The night above shows them towards the end of the night. This didn't fit with the pattern of oxygen desaturation that we saw begin around an hour after sleep onset, even whilst on CPAP, hence we weren't sure how much to trust the detected central apnoeas as they seemed few and far between. However, if someone has both obstructive and central apnoeas, CPAP can reveal those central ones after it has removed the clutter of obstructive apnoeas.
The CPAP that he was prescribed was "Auto-titrating CPAP" this means that the machine decides which pressures are needed. You can see this in the graph above (the pressure line varies throughout the night). Intriguingly, the when the pressure is the highest there are no apnoeas, but he still desaturated.
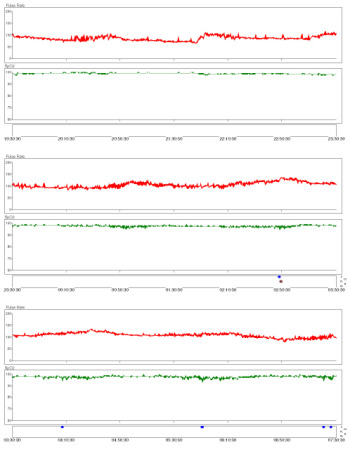
The auto-pressure function can be set to choose between limits, or forced to give a constant set pressure. After many nights of alarms. We obtained a chart from a night at 6cmH20 (left) and a night at 15cmH20 (right) to see what was going on.
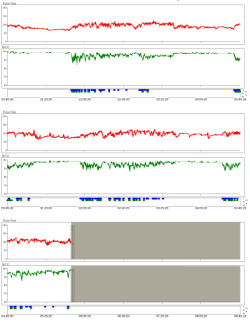
6cmH20 had little effect. 15cmH20 was better, but still unacceptable and uncomfortable for him.
He would wake in the middle of the night and not be able to call out due to the mask over his nose and mouth. His heart rate would then increase and his alarm sound to alert me. I'd have to turn the CPAP off and it would have to be re-ramped again (start at a low pressure and build up over time, hoping that he was asleep before it delivered high pressure again).
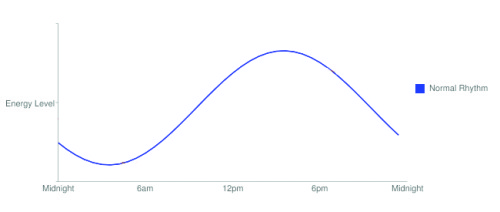
Because his blood-oxygen only dropped at certain times of the night rather than be low ALL night it was suspected that it had something to do with a particular stage of sleep. Below is a picture of a normal hypnogram (a graph detailing the stages of sleep, as shown on the Zeo entry of this blog) overlaid with a graph of his oxygen levels from one night.
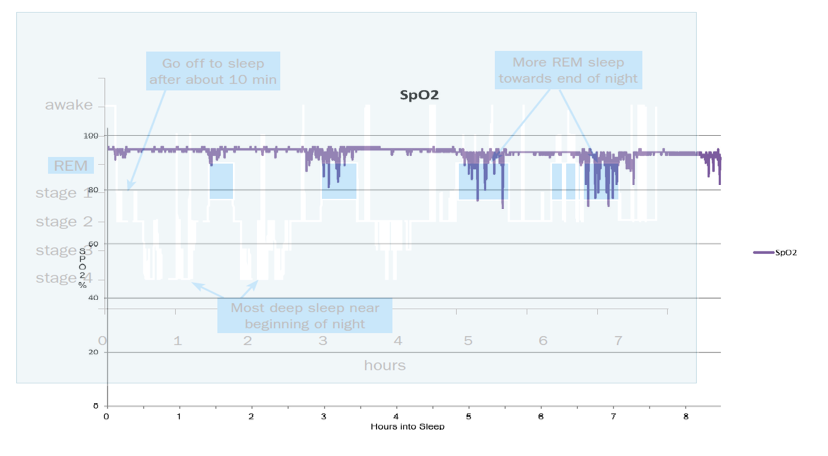
Seeing this was a goosebump moment...
The pattern of his oxygen desaturations matched up really well with a standard hypnogram, so it was pretty certain that his condition was REM related. However, this wasn't a graph of his REM. A way of working out and recording when he was in REM was needed.
New equipment was also needed...
Due to the possible presence of central apnoeas, it seemed unlikely that CPAP was going to be an effective solution, afterall there is little point in keeping the airway open if the brain isn't initiating a breath (or the muscles aren't able to respond to the signal to breathe). It was suspected that he would need Bi-level ventilation. Well known brand names for this are BiPAP and VPAP.
These are both Bi-level Positive Airway Pressure devices. Bi-level delivers two alternating pressures. The higher one is the IPAP (Inspiratory Positive Airway Pressure) and the lower one is the EPAP (Expiratory Positive Airway Pressure). The IPAP is essentially the breath, while the EPAP is the amount of pressure required in order to keep the airway open. Usually the breaths are triggered by the sleeper's breathing efforts, but to cover the possibility that he did indeed also have central apnoeas we used a BiPAP machine that could also be set to deliver "backup breaths" if my son didn't breathe a certain number of times a minute.
The CPAP / BiPAP was delivered via nasal pillows. These are fantastic as they allow the user to speak whilst using them. However, this left us with no way of being able to reliably monitor his CO2 using a capnograph.
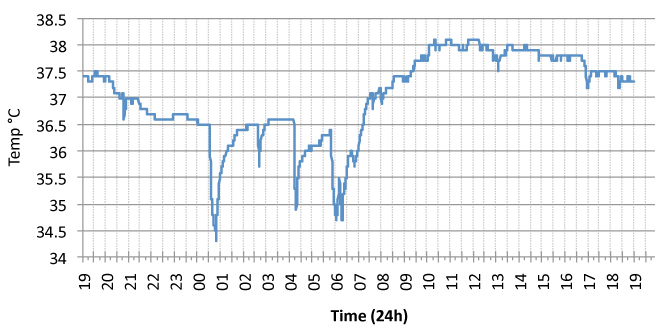
CO2 monitoring is essential, without this it would be too easy to adjust the ventilator so that there were no oxygen desaturations, but actually be hyperventilating him, or worse causing trauma to his lungs and airways; so unless we could find a way to reliably monitor his CO2 we couldn't go any further. A different type of CO2 monitor was bought in... A transcutaneous CO2 monitor.
The transcutaneous CO2 monitor gathers its data by way of a probe that is attached to the skin of the chest or arm. It then heats up the skin and evaluates the gasses given off. The probe needs to be removed after several hours and placed on a new site in order to reduce the risk of probe burns to the skin.
The titration process wasn't a one night affair, so we had the luxury of being able to record readings at home between appointments. However, at home we didn't have an EEG machine to record brainwave data, so we couldn't tell what stage of sleep he was in.
We needed to see when (and if) he achieved REM sleep while his settings were adjusted over the course of several nights. We also needed to make sure that the pressures weren't waking him up. Afterall, if he didn't have much REM (or his REM was disturbed) then his oxygen levels would look good and give the false impression that the settings were working. The Zeo was perfect for this.
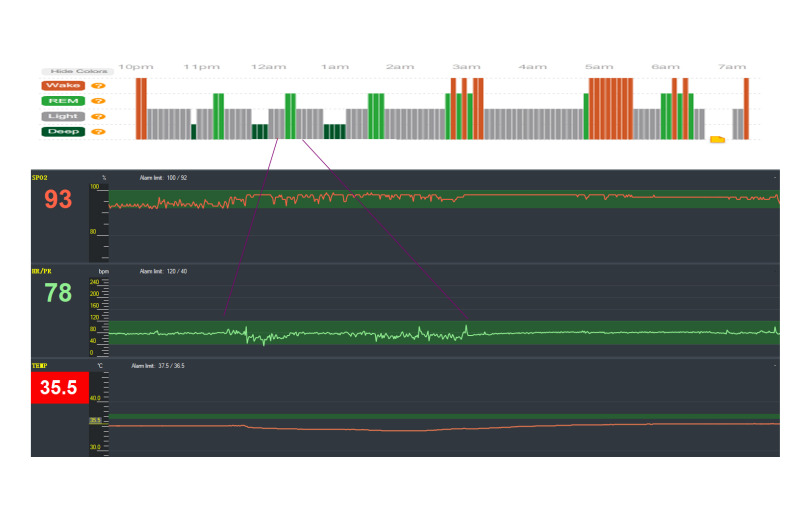
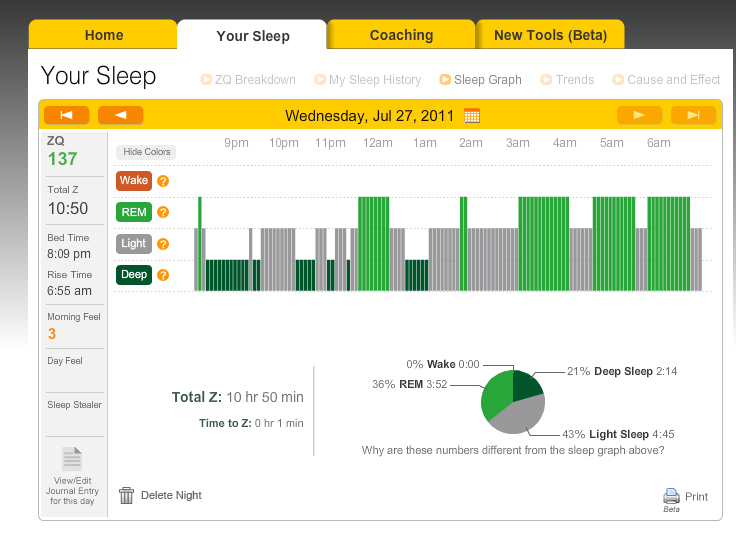
This graph is from one of the first nights of BiPAP (when the settings were good but not optimal) and it shows a great correlation between his oxygen desaturations and Zeo's calculations of REM sleep. (The dips in the green oxygen line are a near perfect match for the green chunks of REM from Zeo), as are the rises in pulse rate and CO2.
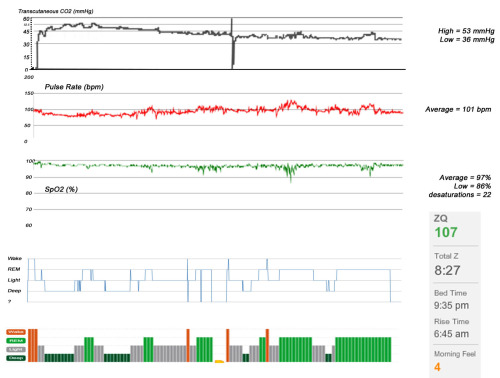
This gave me a lot of confidence in the Zeo's decisions as REM is probably the hardest state to detect due to its similarity to being awake. In fact I'd even feel confident enough to say that the piece of missing data from the Zeo (headband was too loose) would have shown REM.
The result of a few nights adjustments during REM was that BiPAP at the correct pressures eliminated his oxygen desaturations completely and allowed him (and me) to sleep all through the night for the first time in a very long time.
It turned out that obtaining a machine that could provide additional "backup" breaths was a good investment... Pressures alone weren't enough to prevent his oxygen levels dropping, so a backup-rate was set of 13 breaths per minute.
This meant that if he didn't breathe 13 times a minute of his own accord, that the machine would make up the number of breaths.
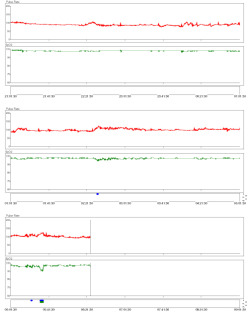
The graph on the left is with BiPAP pressures set to 18/10. This was fine for his oxygen requirements, but it still was uncomfortable for him (but tolerable). The high EPAP of 10cmH20 made it hard for him to exhale (remember that he has neuro-muscular issues).
The pressures were re-titrated but this time with a lower EPAP. This seems essential for him to be able to exhale effectively, and provides a more comfortable night.
These settings will be reviewed periodically by the medical professionals that have been involved in his care to see if they are still optimal.
He now loves the BiPAP machine and doesn't like sleeping without it, he doesn't sleep in until noon at the weekends, he doesn't fall asleep at school and can stay awake until long into the evening. He also has a ZQ of 137 which he likes to use to mock my awful average ZQ of 68.
 Apnoea, Explanations, Monitors